how to utilise semantic-link-labs to gather detailed information about all your power bi reports.

introduction.
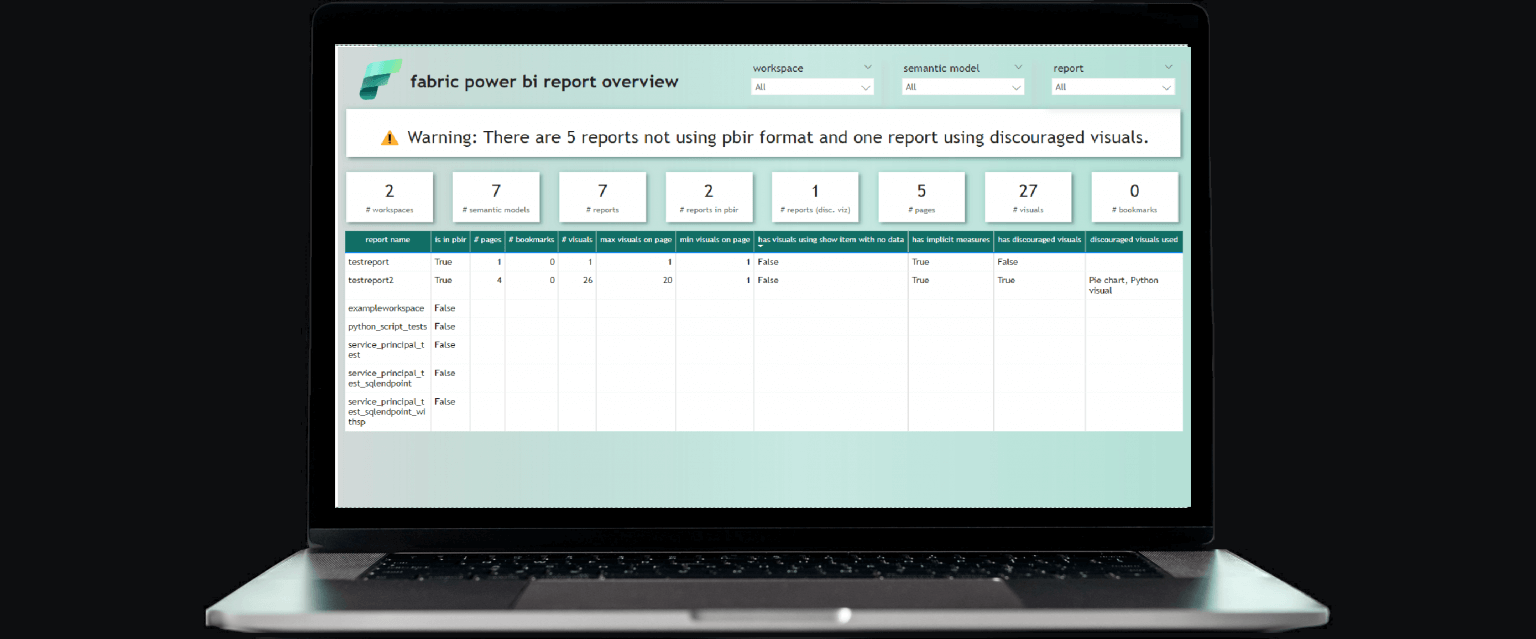
In our previous post, we examined semantic-link-labs and stored data about all accessible semantic models in a dedicated delta table in a Fabric Lakehouse. In this article here, we wanna do the equivalent with all our Power BI reports. Note, the semantic-link features delivering more detailed insights about Power BI reports only work when those reports are using the Power BI enhanced report format (pbir format). That is why, the script below first checks whether a report is in the pbir format. So if you wanna use semantic-link yielding for Power BI reports, it might be worthwhile to promote the usage of pbir in your organization – as soon as you are ready for it and pbir has been released to GA (at time of writing this article, it was still in preview). With pbir, we can easily check the number of pages, visuals or bookmarks, but also the usage of implicit measures. In the script below, we even defined a set of visuals we wanted to discourage, like pie charts or python scripts. At the very end of this article, you can find an example screenshot displaying all columns that result from the script. Feel free to add stuff or align it!
For some inspiration, I also built a Power BI report on top of the resulting delta table. Let me know in the comments below, if you wanna have a copy of the report and I’ll send it to you via email.


prerequisites.
1. A Fabric capacity and workspace
2. A Fabric Lakehouse
plan of action.
1. What’s the goal?
The goal is to utilise semantic-link-labs in order to get information about all our Power BI reports in Fabric (that is, all accessible reports in the pbir format). The aim is to store this information in a delta table and to create a Power BI report on top of it, effectively enhancing our governance capabilities: With such a report we can easily check out whether our analytics engineers and Power BI developers stick to guidelines provided, e.g. are there implicit measures or is maybe even someone displaying the “forbidden” pie chart somewhere ? ;-)
2. The script
Below the snippets of the script. Just create a notebook and copy & paste the snippets. Make sure to attach the notebook to the Lakehouse where the delta table shall reside before executing it. Feel free to set up a schedule for the notebook to run.
We start off by installing semantic-link-labs.
Next, we import all packages needed.
Now, we get all our semantic models and do some basic cleansing on top of them.
With this rather basic “semantic model” dataframe, we can loop over each row and retrieve all downstream reports.
Next, we create a function that checks if each report is in the pbir format. We execute this function on top of the df_reports_combined and add the true/false flag is_pbir_format.
If the report is in pbir, we can add all those interesting stats like number of visuals, bookmarks and pages or the max number of visuals per page. We can even check what kind of visuals are being used within the report and whether there are visuals that are discouraged. For this, we specify an array in line 16 where we can list the types of visuals that we discourage from using in a report.
All that is left now is joining the two dataframes.
And finally, we are ready to save our report meta info as a delta table to our attached Lakehouse.
Here how the table looks like after loading it into Power BI. One can see that only the reports that have is_pbir_format set to true contains the more enriching data.


end.
And this is it! Once again, let me know if you wanna have a copy of the report. Otherwise, I highly encourage you to check out semantic-link-labs for other things as well. They constantly develop the library and there is always new things being released.