
how to build Power BI lineage reports for your event driven architecture with R.

introduction.
If you followed the blog post on how to customize data factory triggers across environments with azure devops pipelines, you can now easily use the created JSON files to illustrate the data flow lineage of your architecture. For this, just connect Power BI to Azure DevOps repository as described in the previous blog post and follow this walkthrough.
This is the result we’d like to achieve – a sliceable graph displaying our Azure ETL Infrastructure:

prerequisites.
1. Same or similar JSON files that configure your data factory triggers
2. Power BI Desktop
plan of action.
1. What is our starting point?
2. Transform data in Power Query
3. Add R script in Power BI report.
1. What is our starting point?
Let’s start off by looking into our example architecture:

Looks pretty complicated, huh? Well, that is the reason why we wanna use Power BI for automating the documentation part. But to begin with, let us quickly see what this architecture actually is about:
– We have technically four different sources (CRM, ERP, MDM, HR) of which two have a test and prod environment (CRM, ERP).
– All systems, except MDM, have a so called drop-off area where the respective data factory pushes data to. See an explanation for this
design in the appendix.
– There are three environments (dev, test, prod) for our data platform (delta lake):
– Dev pulls data only from prod drop-off areas when there is no test drop-off area available (developers shall only have prod
access if they really have to)
– Test pulls data from all drop-off areas (to be able to test any work load)
– Prod pulls data only from prod drop-off areas (only prod data for robustness)
– In addition, there are two public drop-off areas for external consumers. These areas receive the data via their own data factories
– The architecture is exclusively event driven where there is one global Azure Event Grid resource steering the event triggering. The event grid is not displayed in the picture above. The way it works is that each data factory pipeline calls the event grid when it has been completed. All downstream data factories have subscribed to certain topics of the event grid via custom triggers listening to the calls received by the event grid. The ones with an active custom trigger will automatically start their pipeline runs when the event grid resource receives the respective API call. If you’d like to find out more on how to set this up, I recommend this blog post here.
To follow this micro-service-alike approach, we end up with five different data loadings:
– From CRM to Drop-Off (test & prod)
– From ERP to Drop-Off (test & prod)
– From HR to Drop-Off (prod)
– From Drop-Off/MDM to Data Platform (dev, test & prod)
– From Data Platform to Public Drop-Off (test & prod)
To keep up ownership, data governance and deployment robustness, every data loadings is mapped to its own data factory.
Each of the ten data factories has its own trigger configuration which is why we also end up with ten different JSON files laying in our CICD folder in Azure DevOps:
CRM Test:
{
    "triggers": [
        {"name":"daily_full", "action":"activate", "type": "scheduled",         "sourcesystem":"crm",   "sourcesystemenvironment":"test",  "callingclient":"datafactory-crm-test"},
        {"name":"hourly_inc", "action":"activate", "type": "scheduled",         "sourcesystem":"crm",   "sourcesystemenvironment":"test",  "callingclient":"datafactory-crm-test"}
    ]
}
CRM Prod:
{
    "triggers": [
        {"name":"daily_full", "action":"activate", "type": "scheduled",         "sourcesystem":"crm",   "sourcesystemenvironment":"prod",  "callingclient":"datafactory-crm-prod"},
        {"name":"hourly_inc", "action":"activate", "type": "scheduled",         "sourcesystem":"crm",   "sourcesystemenvironment":"prod",  "callingclient":"datafactory-crm-prod"}
    ]
}
ERP Test:
{
    "triggers": [
        {"name":"daily_full", "action":"activate", "type": "scheduled",         "sourcesystem":"erp",   "sourcesystemenvironment":"test",  "callingclient":"datafactory-erp-test"},
        {"name":"hourly_inc", "action":"activate", "type": "scheduled",         "sourcesystem":"erp",   "sourcesystemenvironment":"test",  "callingclient":"datafactory-erp-test"},
        {"name":"hourly_inc_invoice", "action":"activate", "type": "scheduled",         "sourcesystem":"erp",   "sourcesystemenvironment":"test",  "callingclient":"datafactory-erp-test"}
    ]
}
ERP Prod:
{
    "triggers": [
        {"name":"daily_full", "action":"activate", "type": "scheduled",         "sourcesystem":"erp",   "sourcesystemenvironment":"prod",  "callingclient":"datafactory-erp-prod"},
        {"name":"hourly_inc_order", "action":"activate", "type": "scheduled",         "sourcesystem":"erp",   "sourcesystemenvironment":"prod",  "callingclient":"datafactory-erp-prod"},
        {"name":"hourly_inc_invoice", "action":"activate", "type": "scheduled",         "sourcesystem":"erp",   "sourcesystemenvironment":"prod",  "callingclient":"datafactory-erp-prod"}
    ]
}
HR Prod:
{
    "triggers": [
        {"name":"daily_full", "action":"activate", "type": "scheduled",         "sourcesystem":"hr",   "sourcesystemenvironment":"prod",  "callingclient":"datafactory-hr-prod"}
    ]
}
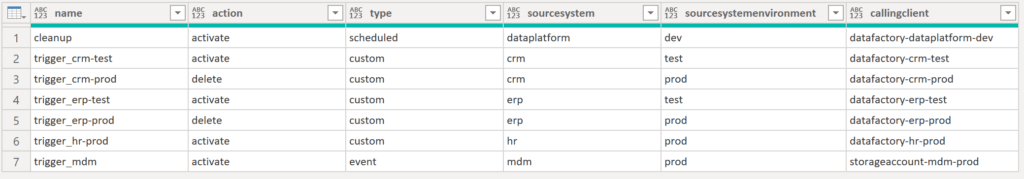
Data Platform Dev:
{
    "triggers": [
        {"name":"cleanup",          "action":"activate", "type": "scheduled",   "sourcesystem":"dataplatform",   "sourcesystemenvironment":"dev",   "callingclient":"datafactory-dataplatform-dev"},
        {"name":"trigger_crm-test", "action":"activate", "type": "custom",      "sourcesystem":"crm",            "sourcesystemenvironment":"test",  "callingclient":"datafactory-crm-test"},
        {"name":"trigger_crm-prod", "action":"delete",   "type": "custom",      "sourcesystem":"crm",            "sourcesystemenvironment":"prod",  "callingclient":"datafactory-crm-prod"},
        {"name":"trigger_erp-test", "action":"activate", "type": "custom",      "sourcesystem":"erp",            "sourcesystemenvironment":"test",  "callingclient":"datafactory-erp-test"},
        {"name":"trigger_erp-prod", "action":"delete",   "type": "custom",      "sourcesystem":"erp",            "sourcesystemenvironment":"prod",  "callingclient":"datafactory-erp-prod"},
        {"name":"trigger_hr-prod",  "action":"activate", "type": "custom",      "sourcesystem":"hr",             "sourcesystemenvironment":"prod",  "callingclient":"datafactory-hr-prod"},
        {"name":"trigger_mdm",	    "action":"activate", "type": "event",       "sourcesystem":"mdm",            "sourcesystemenvironment":"prod",  "callingclient":"storageaccount-mdm-prod"}
    ]
}
Data Platform Test:
{
    "triggers": [
        {"name":"cleanup",          "action":"activate", "type": "scheduled",   "sourcesystem":"dataplatform",   "sourcesystemenvironment":"test",   "callingclient":"datafactory-dataplatform-test"},
        {"name":"trigger_crm-test", "action":"activate", "type": "custom",      "sourcesystem":"crm",            "sourcesystemenvironment":"test",  "callingclient":"datafactory-crm-test"},
        {"name":"trigger_crm-prod", "action":"activate", "type": "custom",      "sourcesystem":"crm",            "sourcesystemenvironment":"prod",  "callingclient":"datafactory-crm-prod"},
        {"name":"trigger_erp-test", "action":"activate", "type": "custom",      "sourcesystem":"erp",            "sourcesystemenvironment":"test",  "callingclient":"datafactory-erp-test"},
        {"name":"trigger_erp-prod", "action":"activate", "type": "custom",      "sourcesystem":"erp",            "sourcesystemenvironment":"prod",  "callingclient":"datafactory-erp-prod"},
        {"name":"trigger_hr-prod",  "action":"activate", "type": "custom",      "sourcesystem":"hr",             "sourcesystemenvironment":"prod",  "callingclient":"datafactory-hr-prod"},
        {"name":"trigger_mdm",	    "action":"activate", "type": "event",       "sourcesystem":"mdm",            "sourcesystemenvironment":"prod",  "callingclient":"storageaccount-mdm-prod"}
    ]
}
Data Platform Prod:
{
    "triggers": [
        {"name":"cleanup",          "action":"activate", "type": "scheduled",   "sourcesystem":"dataplatform",   "sourcesystemenvironment":"prod",  "callingclient":"datafactory-dataplatform-prod"},
        {"name":"trigger_crm-test", "action":"delete",   "type": "custom",      "sourcesystem":"crm",            "sourcesystemenvironment":"test",  "callingclient":"datafactory-crm-test"},
        {"name":"trigger_crm-prod", "action":"activate", "type": "custom",      "sourcesystem":"crm",            "sourcesystemenvironment":"prod",  "callingclient":"datafactory-crm-prod"},
        {"name":"trigger_erp-test", "action":"delete",   "type": "custom",      "sourcesystem":"erp",            "sourcesystemenvironment":"test",  "callingclient":"datafactory-erp-test"},
        {"name":"trigger_erp-prod", "action":"activate", "type": "custom",      "sourcesystem":"erp",            "sourcesystemenvironment":"prod",  "callingclient":"datafactory-erp-prod"},
        {"name":"trigger_hr-prod",  "action":"activate", "type": "custom",      "sourcesystem":"hr",             "sourcesystemenvironment":"prod",  "callingclient":"datafactory-hr-prod"},
        {"name":"trigger_mdm",	    "action":"activate", "type": "event",       "sourcesystem":"mdm",            "sourcesystemenvironment":"prod",  "callingclient":"storageaccount-mdm-prod"}
    ]
}
Public Drop-Off Test:
{
    "triggers": [
        {"name":"trigger_publicdropoff-test", "action":"activate", "type": "custom",      "sourcesystem":"dataplatform", "sourcesystemenvironment":"test",  "callingclient":"datafactory-dataplatform-test"}
    ]
}
Public Drop-Off Prod:
{
    "triggers": [
        {"name":"trigger_publicdropoff-prod", "action":"activate", "type": "custom",      "sourcesystem":"dataplatform", "sourcesystemenvironment":"prod",  "callingclient":"datafactory-dataplatform-prod"}
    ]
}
Next, load the JSON files into Power BI from Azure DevOps (see previous blog post)
2. Transform data in Power Query.
Load the files into Power Query:
Then, add the two columns targetsystem and targetsystemenvironment:

Do the above for all JSON files and append all of them into one table:

3. Add R script in Power BI report.
First, you need to set up R and connect it to Power BI. Go to Settings > Options > R scripting and follow the instructions:

Also, install the packages tidyverse, igraph and ggchicklet so the R script works as it should.
Now, add a R script visual to the report, drag in the fields sourcesystem, sourcesystemenviornment, action, targetsystem and targetsystemenvironment and open up the R script editor:

You might need to enable this:

Copy and paste the following R script into the R script editor:
# load in packages
library(tidyverse)
library(igraph)
library(ggchicklet)

# load the tibble
architecture <- dataset %>%
  mutate ( from = sourcesystem ) %>%
  mutate ( to =   targetsystem ) %>%
  filter ( action == "activate", to != from) %>%
  select ( c ( to, from ) )

# define the layout
g = graph_from_data_frame(architecture[c("from","to")], directed = TRUE)
coords = layout_as_tree(g, circular = FALSE, flip.y = TRUE, mode = "out")
colnames(coords) = c("y", "x")

# add attributes
output_df = as_tibble(coords) %>%
  mutate(step = vertex_attr(g, "name"),
         label = gsub("\\d+$", "", step),
         x = x * -1,
         y = ceiling(y)) %>%
  left_join(architecture, by = c("step" = "from" ) ) %>%
  left_join(architecture, by = c("step" = "to" ) ) %>%
  subset ( select = c( y, x, step, label ) ) %>%
  distinct( .keep_all = FALSE )

# create the rectangles
plot_nodes = output_df %>%
  mutate(xmin = x + 0.35,
         xmax = x - 0.35,
         ymin = y - 0.25,
         ymax = y + 0.25)

# create edges
plot_edges =  architecture %>%
  mutate(id = row_number()) %>%
  pivot_longer(cols = c("from", "to"),
               names_to = "s_e",
               values_to = "step") %>%
  left_join(plot_nodes, by = "step") %>%
  select(-c(label, y, xmin, xmax)) %>%
  mutate(y = ifelse(s_e == "from", ymin + 0.25, ymax)) %>%
  select(-c(ymin, ymax))

# draw rectangles
p = ggplot() +
  ggchicklet:::geom_rrect(data = plot_nodes,
                          mapping = aes(xmin = xmax, ymin = ymin,
                                        xmax = xmin, ymax = ymax),
                          fill ="#027DFF",
                          r  = unit(0.5, "npc"))

# add lables
p = p +
  geom_text(data = plot_nodes,
            mapping = aes(x = x, y = y, label = label),
            family = "Segoe UI",
            color = "white",
            size = 6)

plot_arrows = plot_edges %>%
  mutate(x = ifelse(s_e == "from", x + 0.35, x - 0.35)) %>%
  mutate(y = ifelse(s_e == "from", y - 0, y-0.25))
plot_arrows

# draw arrows
p = p +
  geom_path(data = plot_arrows,
            mapping = aes(x = x, y = y, group = id),
            colour = "#027DFF",
            arrow = arrow(length = unit(0.2, "cm"), type = "closed"))

# fix design
p = p +
  theme(
    panel.background = element_rect(fill = "black"),
    plot.background  = element_rect(fill = "black", colour ="black"),
    panel.grid.major = element_blank(),
    panel.grid.minor = element_blank(),
    axis.text  = element_blank(),
    axis.ticks = element_blank(),
    panel.border = element_blank(),
    legend.background = element_rect(fill = "black"),
    legend.position = "bottom",
    legend.text = element_text(size = 16, colour = "white", family = "Segoe UI"),
    legend.title = element_blank()
  )
p
Here the result of the R visual:

Here the other R script:
 # load in packages
 library(tidyverse)
 library(igraph)
 library(ggchicklet)

 # load the tibble
 architecture <- dataset %>%
    mutate ( from = paste ( sourcesystem, sourcesystemenvironment , sep = "-" ) ) %>%
    mutate ( to =   paste ( targetsystem, targetsystemenvironment , sep = "-" ) ) %>%
    filter ( action == "activate", to != from) %>%
    select ( c ( to, from, sourcesystemenvironment, targetsystemenvironment ) )

 # define the layout
 g = graph_from_data_frame(architecture[c("from","to")], directed = TRUE)
 coords = layout_as_tree(g, circular = FALSE, flip.y = TRUE, mode = "out")
 colnames(coords) = c("y", "x")

 # add attributes
 output_df = as_tibble(coords) %>%
 mutate(step = vertex_attr(g, "name"),
         label = gsub("\\d+$", "", step),
         x = x * -1,
         y = ceiling(y)) %>%
  left_join(architecture, by = c("step" = "from" ) ) %>%
  left_join(architecture, by = c("step" = "to" ) ) %>%
  mutate ( env = coalesce ( targetsystemenvironment.y, sourcesystemenvironment.x ) ) %>%
  subset ( select = c( y, x, step, label, env ) ) %>%
  distinct( .keep_all = FALSE )

 # create the rectangles
 plot_nodes = output_df %>%
   mutate(xmin = x + 0.35,
          xmax = x - 0.35,
          ymin = y - 0.25,
          ymax = y + 0.25)

 # create edges
 plot_edges =  architecture %>%
   mutate(id = row_number()) %>%
   pivot_longer(cols = c("from", "to"),
                names_to = "s_e",
                values_to = "step") %>%
   left_join(plot_nodes, by = "step") %>%
   select(-c(label, env, y, xmin, xmax)) %>%
   mutate(y = ifelse(s_e == "from", ymin + 0.25, ymax)) %>%
   select(-c(ymin, ymax))

 # draw rectangles
 p = ggplot() +
   ggchicklet:::geom_rrect(data = plot_nodes,
                           mapping = aes(xmin = xmax, ymin = ymin,
                                         xmax = xmin, ymax = ymax,
                                         fill = env, colour = env),
                           r  = unit(0.5, "npc"))

  # add lables
  p = p +
   geom_text(data = plot_nodes,
             mapping = aes(x = x, y = y, label = label),
             family = "Segoe UI",
             color = "white",
             size = 6)

  plot_arrows = plot_edges %>%
    mutate(x = ifelse(s_e == "from", x + 0.35, x - 0.35)) %>%
    mutate(y = ifelse(s_e == "from", y - 0, y-0.25))

  # draw arrows
  p = p +
    geom_path(data = plot_arrows,
              mapping = aes(x = x, y = y, group = id),
              colour = "#027DFF",
              arrow = arrow(length = unit(0.25, "cm"), type = "closed"))

  # fix design
  p = p +
    scale_fill_manual(values  = c("dev" = "#3399FF", "test" = "#027DFF", "prod" = "#0039A9")) +
    scale_color_manual(values = c("dev" = "black", "test" = "black", "prod" = "black")) +
    theme(
      panel.background = element_rect(fill = "black"),
      plot.background  = element_rect(fill = "black", colour ="black"),
      panel.grid.major = element_blank(),
      panel.grid.minor = element_blank(),
      axis.text  = element_blank(),
      axis.ticks = element_blank(),
      panel.border = element_blank(),
      legend.background = element_rect(fill = "black"),
      legend.position = "bottom",
      legend.text = element_text(size = 16, colour = "white", family = "Segoe UI"),
      legend.title = element_blank()
    )
  p
Here the resulting visual:

end.
That was it! We successfully fetched the JSON files from Azure DevOps into Power BI and created a responsive lineage R visual on top of it. You could make this report even more advanced by decorating the Power BI model with more of the Azure Data Factory JSON definitions. Why not even using some of the logs that data factory provides? Your creativity sets the limit.
appendix.
You might have wondered why we have so many drop-off areas increasing the solution’s overall complexity and maintenance. I must admit from a developer perspective this seems to be an overkill at first sight. However, having implemented this architecture, it does come with its advantages. The drop-off areas work not only as containers but also as clear contracts between the source system and the data platform. Since outbound ETL, data factory and the drop-off area altogether belong to the respective source, there is no way the consumer is able to fetch the wrong data or generally gain access that it is not supposed to. The source has full control over what data is being pushed out, in which format and when. If multiple consumers need access to the same kind of data then either of them can just get it from the drop-off area. This minimises load pressure on the source system as consumers do not need to enter the source system asking for the same data. Lastly, our most privileged data factory has access to all drop-off areas but not to any source system directly. This is an important security aspect.
Yet, no rule without an exemption: For the mdm system we decided to not have a drop-off area as security requirements were significantly lower and the advantage of lower maintenance and performance outweighed the governance side. In some cases, it makes sense to be open for pragmaticism not following architectural principles all too dogmatically. Yet, choose these exemptions wisely and make sure they do not get out of control.