blogging about databiazurepower bifabric since 2021.
blogging about databiazurepower bifabric since 2021.
Welcome to tackytech! My name is Tom and I love sharing my learnings, views and ideas about data within the Azure universe. Hopefully you get something out of this blog! Wanna know more about me? Check out the about section.
latest blog posts.

A simple and proven way to debug and examine efficacy of a tabular model in Visual Studio, is to use the “Analyze in Excel” function. It is, however, also feasible to test the project in Power BI without deploying the model. This blog post shows you how.

Sometimes you need a proper amount of data to test, lab or to be able to try out new features. This blog post shows you how to populate an Azure SQL Database with (the "real") AdventureWorks sample data (and not the lightweight version).

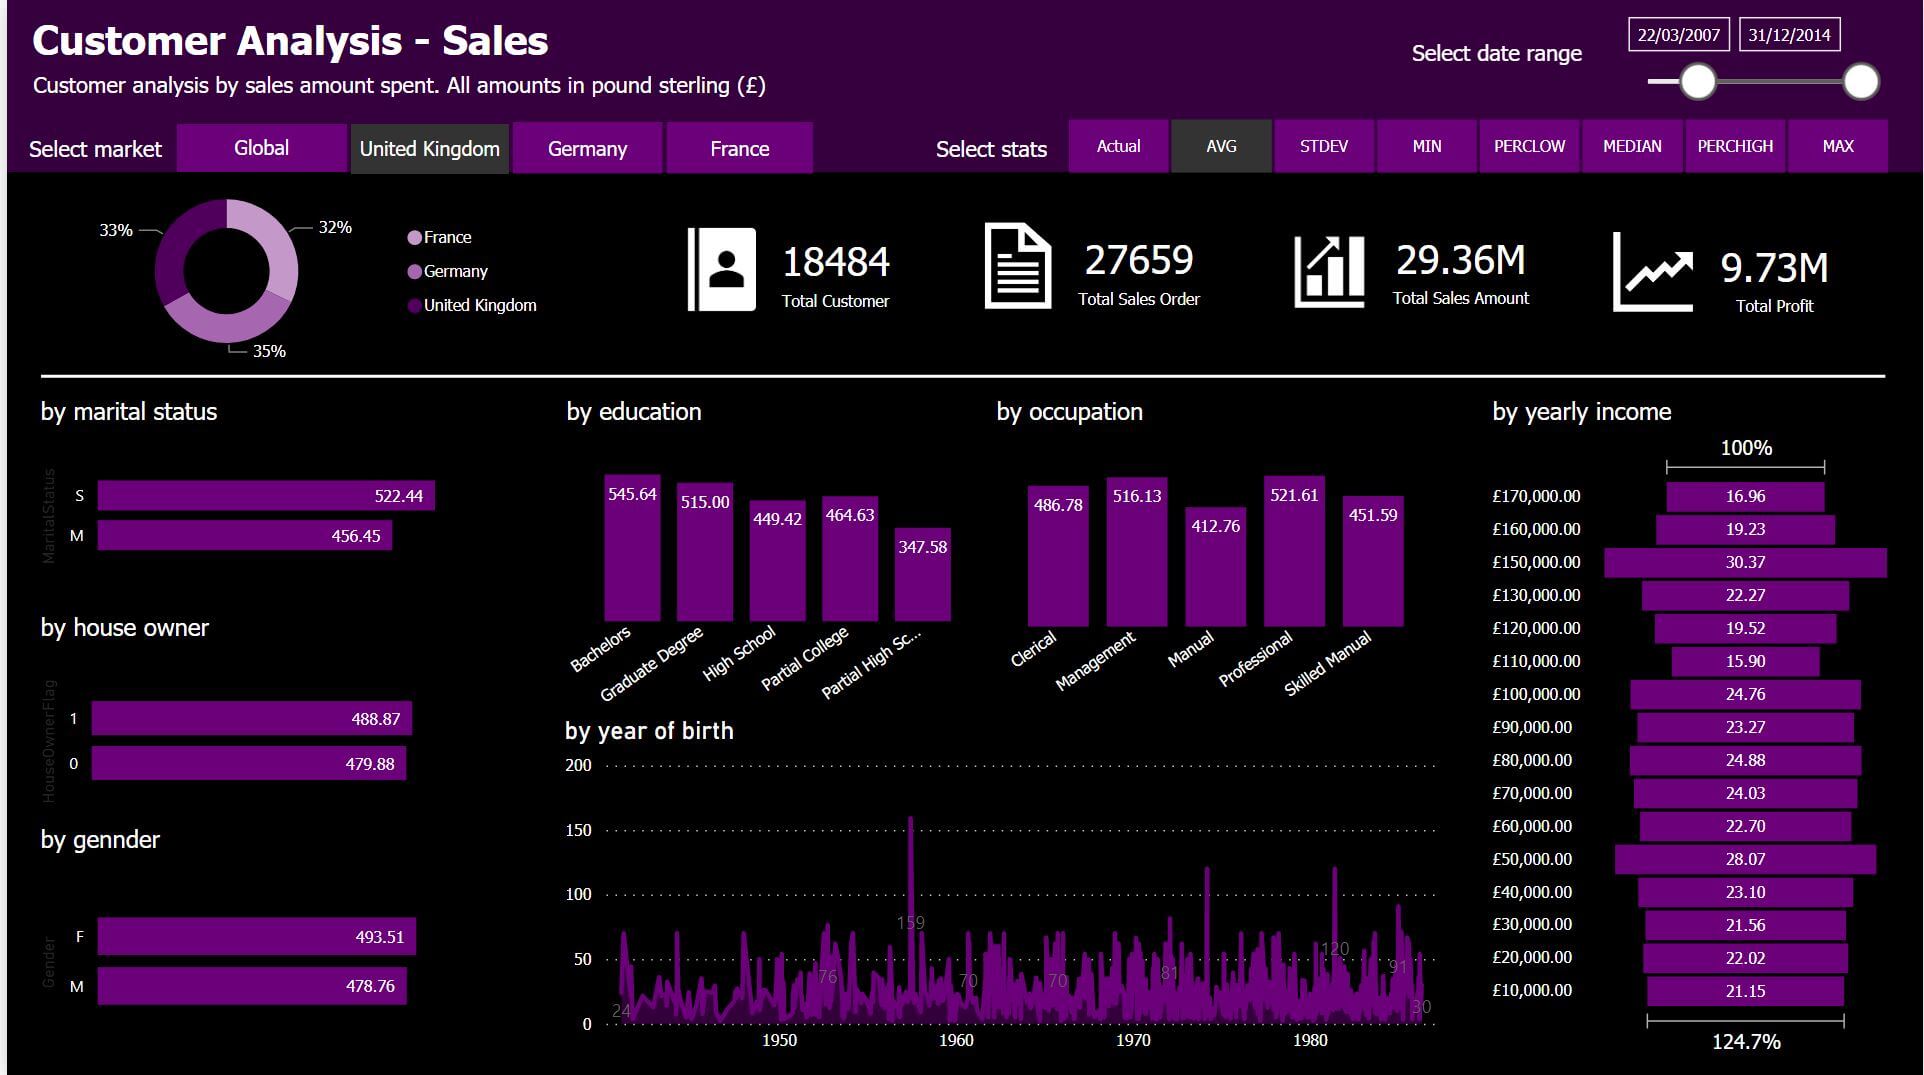
Yet, another example on how you can use calculation groups: Get some simple stats from your dataset by just choosing the function in need from a slicer or filter.
A simple and proven way to debug and examine efficacy of a tabular model in Visual Studio, is to use the “Analyze in Excel” function. It is, however, also feasible to test the project in Power BI without deploying the model. This blog post shows you how.
Sometimes you need a proper amount of data to test, lab or to be able to try out new features. This blog post shows you how to populate an Azure SQL Database with (the "real") AdventureWorks sample data (and not the lightweight version).
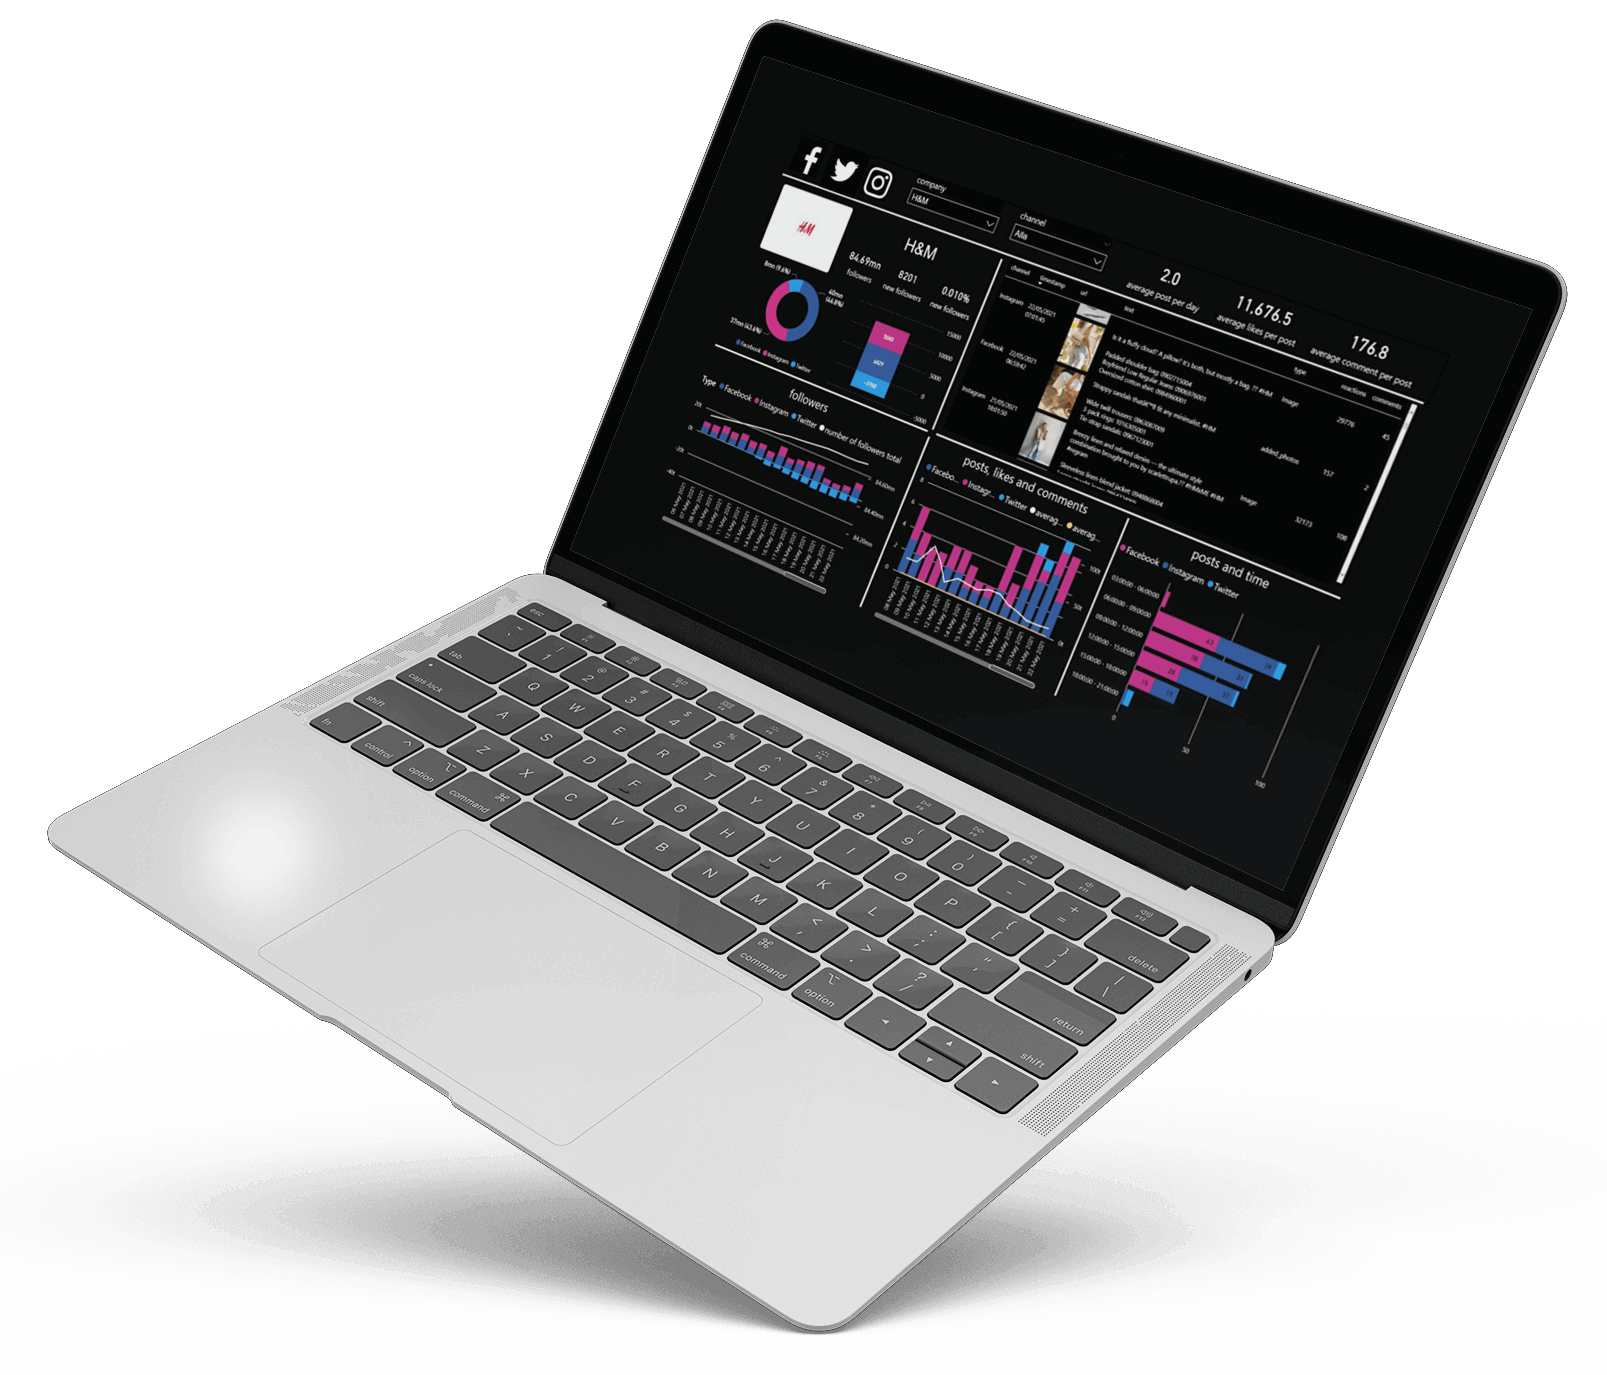
Though my main focus lays on the data engineering and data modelling part, I think it’s also fun to build reports at times. Feel free to leave some feedback!
post categories.