
how to get the latest exchange rates straight into power bi.

introduction.
Translating and bundling monetary transactions in different currencies is a known reporting issue, in particular for globally operating companies. Especially when currencies suffer high fluctuation, it can be very important for decision makers to get converted figures in (near) real time. That’s why, it might be worth a thought to fetch exchange rates in the ETL as lately as possible. In this blog post, we will show you a way to get exchange rates straight from yahoo finance into your Power BI dataset.
.
prerequisites.
1. Power BI Desktop
2. An installed Python version including the packages yfinance and pandas (this and this should help you to get set)
3. A data model in Power BI that contains a currency dimension including a key following ISO 4217 (i.e. “USD”, “GBP”, “EUR”)
.
plan of action.
1. Create the query in Power Query Editor
2. Integrate the exchange rate table into your existing model
.
1. create the query in power query editor.
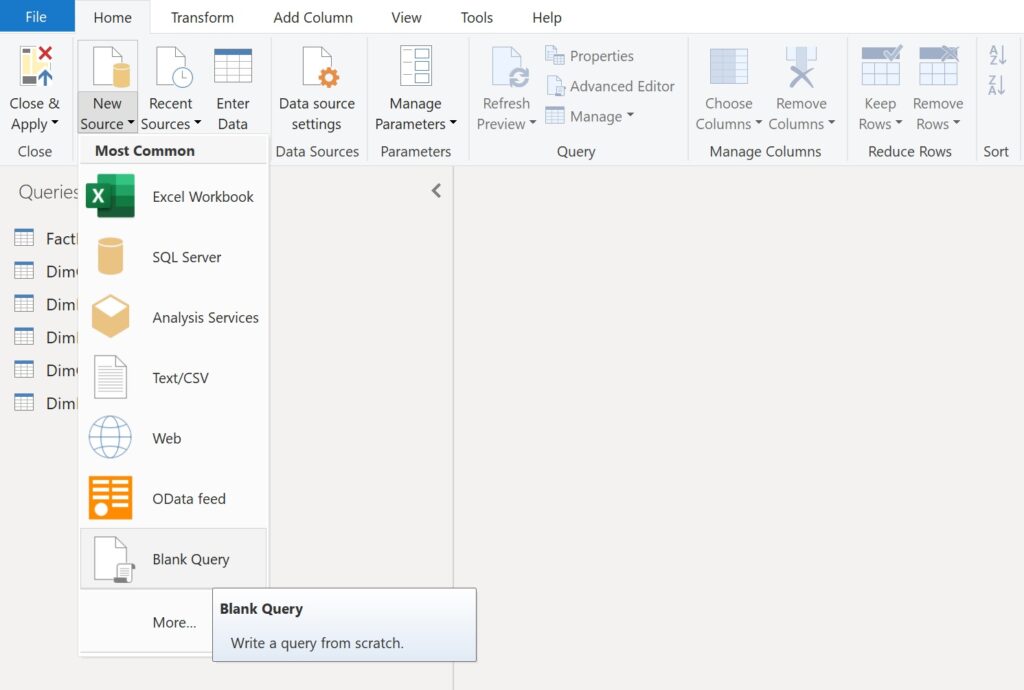
In Power Query Editor, click on New Source and choose Blank Query.
.
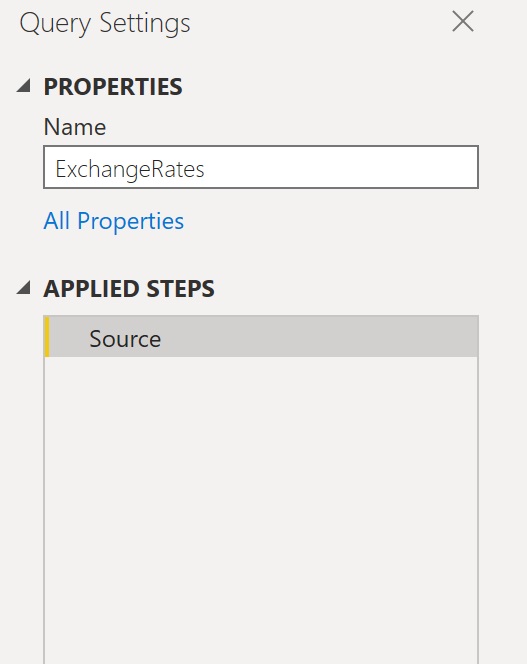
Change the Name of the query on the right hand side.
.
Write the following code snippet in the query window.
= Python.Execute("")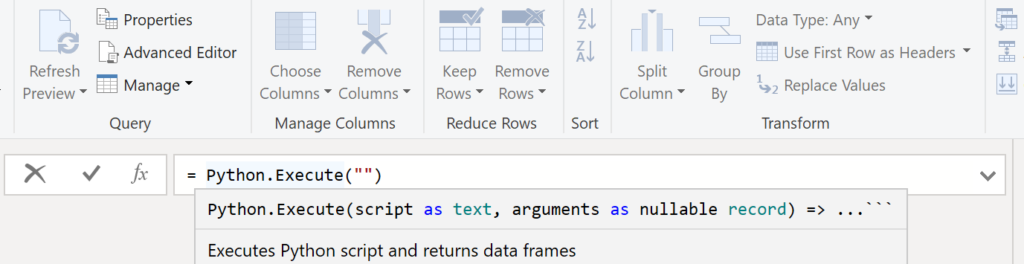
.
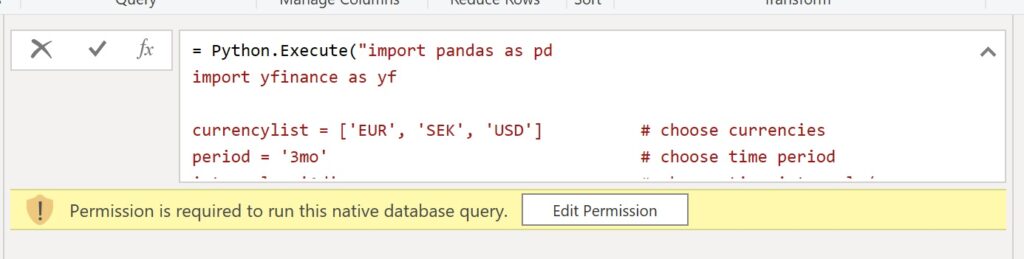
Between the quotation marks, insert the subsequent python code.
Three parameters shall be set in advance:
- currencylist : The currency codes for which the exchange rates should be retrieved. The code below calculates the cartesian product of the list, meaning every currency is converted to every other currency in the list. In some cases, it is only needed to convert all currencies to one. For that case, see the appendix.
- period: The time frame to get historic exchange rates (possible values can be “1d”, “5d”, “1mo”, “3mo”, “6mo”, “1y”, “2y”, “5y”, “10y”, “ytd”, “max”)
- interval: The granularity of the historic rates (possible values can be “1m”, “2m”, “5m”, “15m”, “30m”, “60m”, “90m”, “1h”, “1d”, “5d”, “1wk”, “1mo”, “3mo”)
import pandas as pd
import yfinance as yf
currencylist = ['EUR', 'SEK', 'USD']            # choose currencies
period = '3mo'                                  # choose time period
interval = '1d'                                 # choose time interval / granularity
meta_df = pd.DataFrame (
                         {
                            'FromCurrency': [f'{a}' for a in currencylist for b in currencylist],
                            'ToCurrency':   [f'{b}' for a in currencylist for b in currencylist],
                            'YahooTickers': [f'{a}{b}=X' for a in currencylist for b in currencylist]
                         }
                       )
currency_df = pd.DataFrame (
                            yf.download  (
                                           tickers  = meta_df['YahooTickers'].values[0],
                                           period   = period,
                                           interval = interval
                                         )
                            , columns = ['Open', 'Close', 'Low', 'High']
                            ).assign (
                                      FromCurrency = meta_df['FromCurrency'].values[0],
                                      ToCurrency   = meta_df['ToCurrency'].values[0]
                                     )
for i in range(1, len(meta_df)):
    currency_help_df = pd.DataFrame (
                            yf.download  (
                                           tickers  = meta_df['YahooTickers'].values[i],
                                           period   = period,
                                           interval = interval
                                         )
                            , columns = ['Open', 'Close', 'Low', 'High']
                            ).assign (
                                      FromCurrency = meta_df['FromCurrency'].values[i],
                                      ToCurrency   = meta_df['ToCurrency'].values[i]
                                     )
    currency_df = pd.concat([currency_df, currency_help_df])
currency_df = currency_df.assign ( DateID = currency_df.index )
.
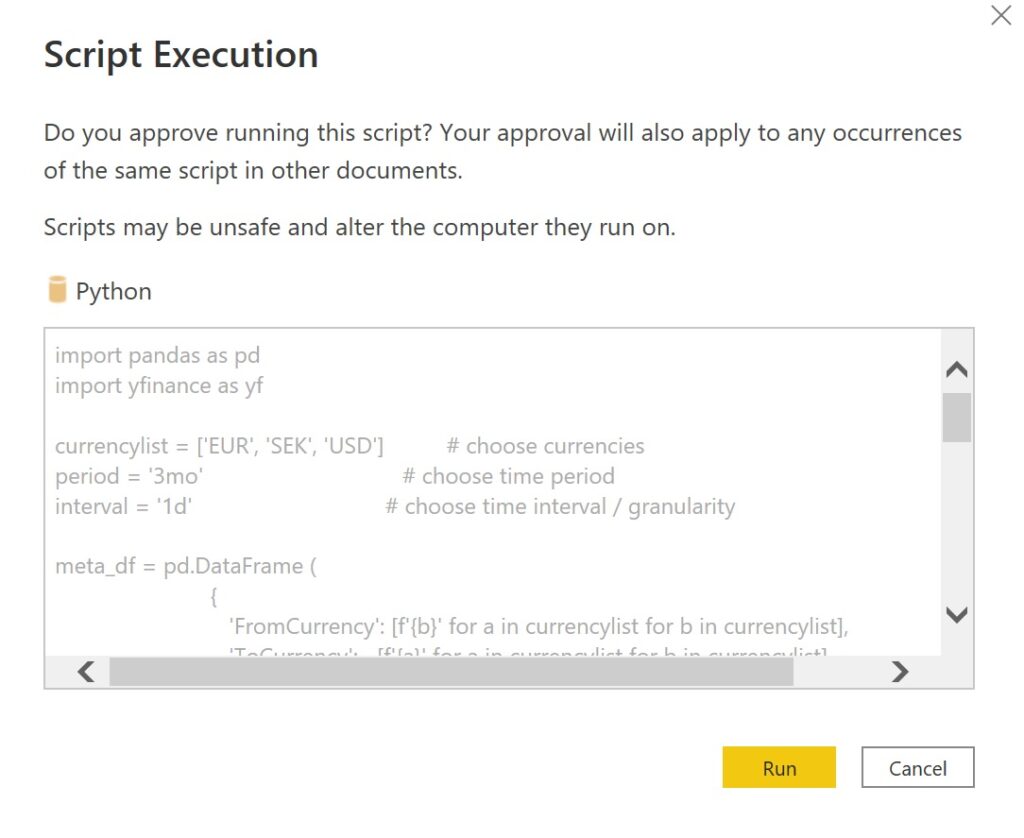
When pasting the python code between the quotation marks, the Edit Permission button might pop up. If so, press it and approve the Script Execution by clicking the Run button.
.
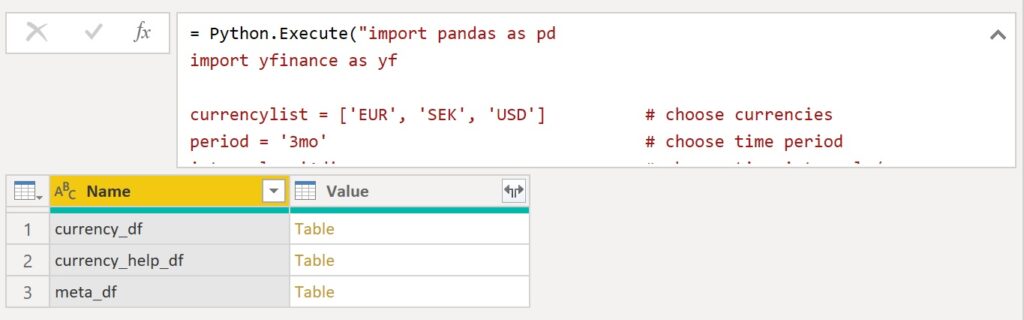
Next, select Table for currency_df:
.
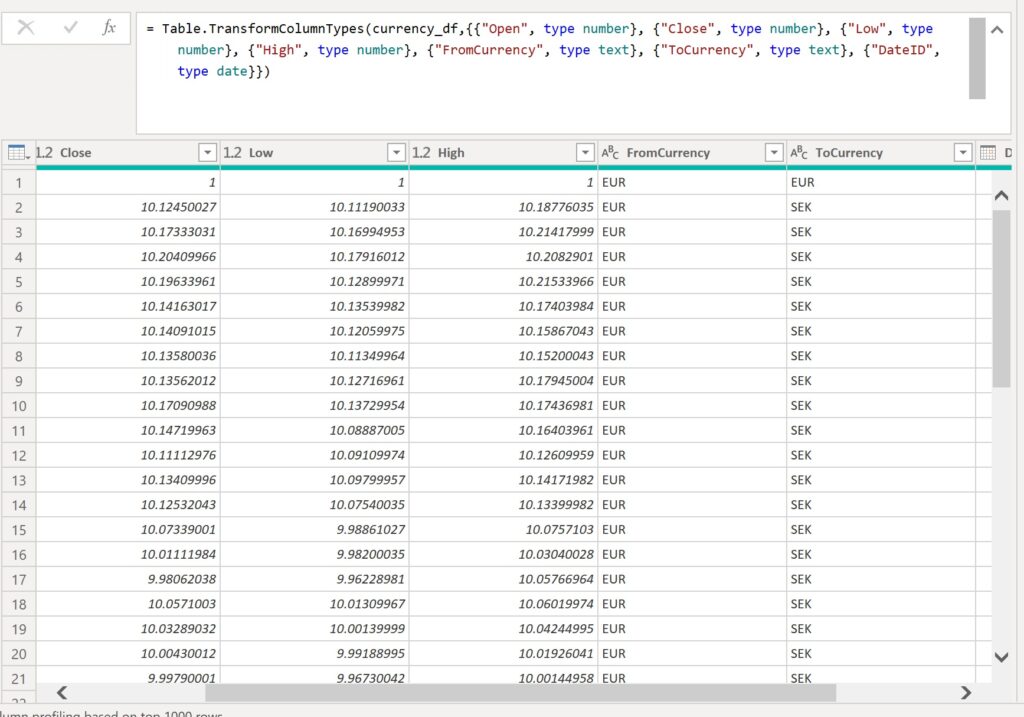
The result should look similar to this. Click Close & Apply.
.
2. integrate the exchange rate table to your existing model.
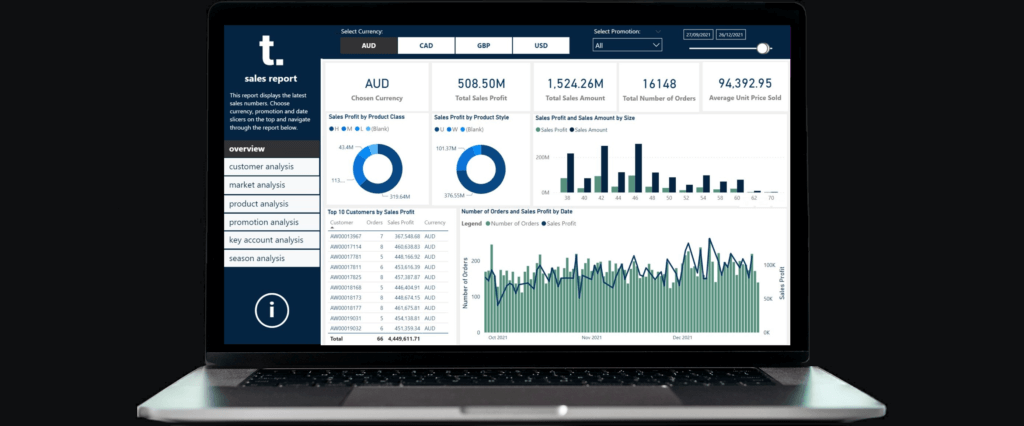
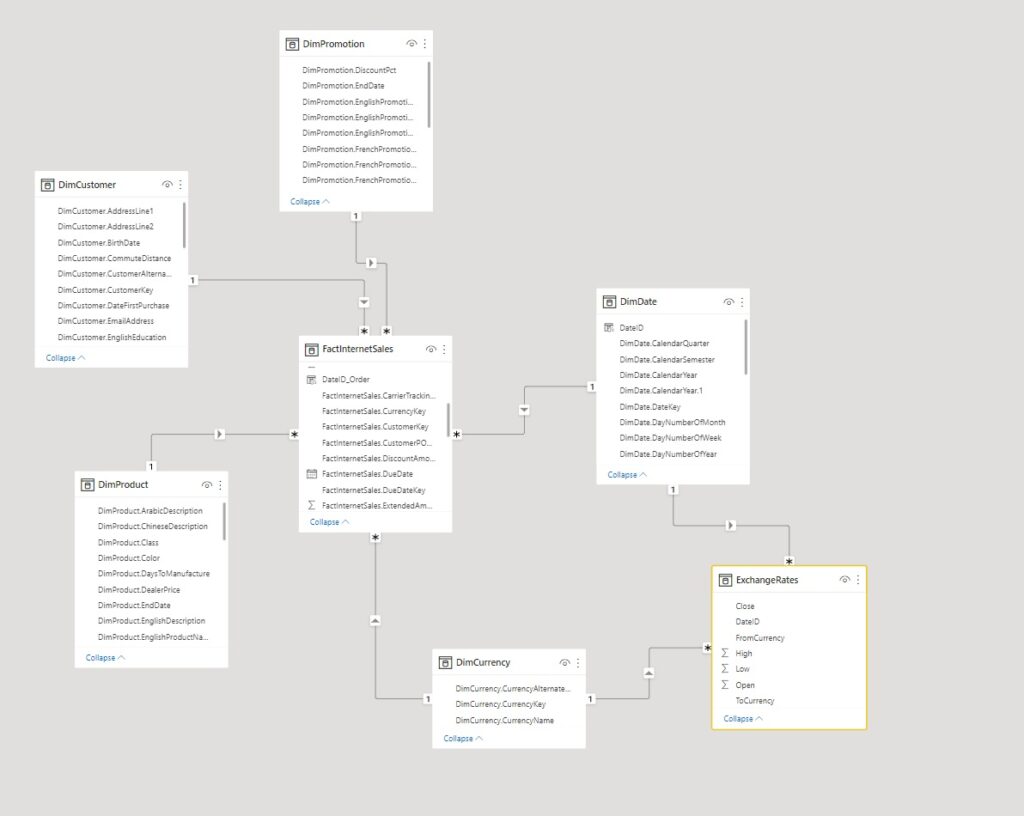
Connect the new ExchangeRate entity with the date and currency dimensions and start building your converting measures. Be aware that now there is a hidden many-to-many relationship from the fact to the exchange rate table which requires extra caution. In the screenshot below, we use a data model based on the AdventureWorks sample that we created here.
.
end.
Now, just click the refresh button and within a couple of seconds you get the latest exchange rates. To make the refresh faster, you can tweak the period and interval parameters. Also, using an incremental load approach to not fetch the same historic conversion rates over and over again, will give you performance benefits.
I warmly recommend checking out some other posts like how to make a service principal the owner of a dataset, how to crack the mystery of the mighty DAX or how to swiftly take over Power Query with the help of some useful gear. These might make your voyage through Power BI a bit easier.
.
appendix.
If your requirement is to convert to only one currency, you can use this python code instead:
import pandas as pd
import yfinance as yf
currencyfromlist = ['EUR', 'SEK', 'USD']      # choose currencies to translate from
currencytolist = ['EUR']                      # choose currencies to translate to
period = '3mo'                                # choose time period
interval = '1d'                               # choose time interval / granularity
meta_df = pd.DataFrame (
                         {
                            'FromCurrency': [f'{a}' for a in currencyfromlist for b in currencytolist],
                            'ToCurrency':   [f'{b}' for a in currencyfromlist for b in currencytolist],
                            'YahooTickers': [f'{a}{b}=X' for a in currencyfromlist for b in currencytolist]
                         }
                       )
currency_df = pd.DataFrame (
                            yf.download  (
                                           tickers  = meta_df['YahooTickers'].values[0],
                                           period   = period,
                                           interval = interval
                                         )
                            , columns = ['Open', 'Close', 'Low', 'High']
                            ).assign (
                                      FromCurrency = meta_df['FromCurrency'].values[0],
                                      ToCurrency   = meta_df['ToCurrency'].values[0]
                                     )
for i in range(1, len(meta_df)):
    currency_help_df = pd.DataFrame (
                            yf.download  (
                                           tickers  = meta_df['YahooTickers'].values[i],
                                           period   = period,
                                           interval = interval
                                         )
                            , columns = ['Open', 'Close', 'Low', 'High']
                            ).assign (
                                      FromCurrency = meta_df['FromCurrency'].values[i],
                                      ToCurrency   = meta_df['ToCurrency'].values[i]
                                     )
    currency_df = pd.concat([currency_df, currency_help_df])
currency_df = currency_df.assign ( DateID = currency_df.index )
Instead of hard coding the currency codes, you could also dynamically fetch them from your currency table. Just substitute
currencylist = ['EUR', 'SEK', 'USD'] # choose currencies
with
currencylist = ['" & Text.Combine(YourCurrencyDimensionTable[CurrencyIsoCode], "', '") & "'] # choose currencies
Note: It might be necessary to align privacy levels, since one data source tries to access data of another data source.
Its like you learn my mind! You seem to know so much
about this, like you wrote the guide in it or something.
I feel that you just could do with some percent to drive the message home
a bit, but instead of that, this is great blog. An excellent read.
I’ll certainly be back.
Hi :) Thank you for your kind words! Always glad, when I can help!
This blog was… how do I say it? Relevant!! Finally I have found something
which helped me. Thanks!
Hi Lauri!
Thank you! Always glad, when my blog helps people :)
/Tom
Hi, I tried using this Python script but the table returns empty. Do you happen to know why that is? Thanks!
Hi Nhung,
Thanks for your message. I tried it myself once more with both scripts and they both work fine on my end. Did you change anything in the script, i.e. other currencies or periods? Have you installed the packages as well?
Let me know!
/Tom